Data Visualization
Oxide and Friends
Data visualization is an important--and overlooked!--tool in the software engineer's tool belt. Bryan describes a recent journey with gnuplot while Oxide colleague, Charlie Park, shares his own experience with data visualization and Adam offers a visual analysis of Simpsons episodes. Stay tuned to the end to find out about the Oxide and Friends book club coming up in May.
In addition to Bryan Cantrill and Adam Leventhal, we were joined by Oxide Colleague, Charlie Park.
- (00:00) - Intro
- (13:39) - OODA
- (22:30) - Back to Bryan
- (24:27) - Flame Graphs
- (28:58) - Statemap
- (32:39) - Minard / Tufte
- (44:53) - thingskatedid
- (46:39) - DTrace aggregations
- (56:06) - ParaView
- (01:03:08) - Simpsons IMDb
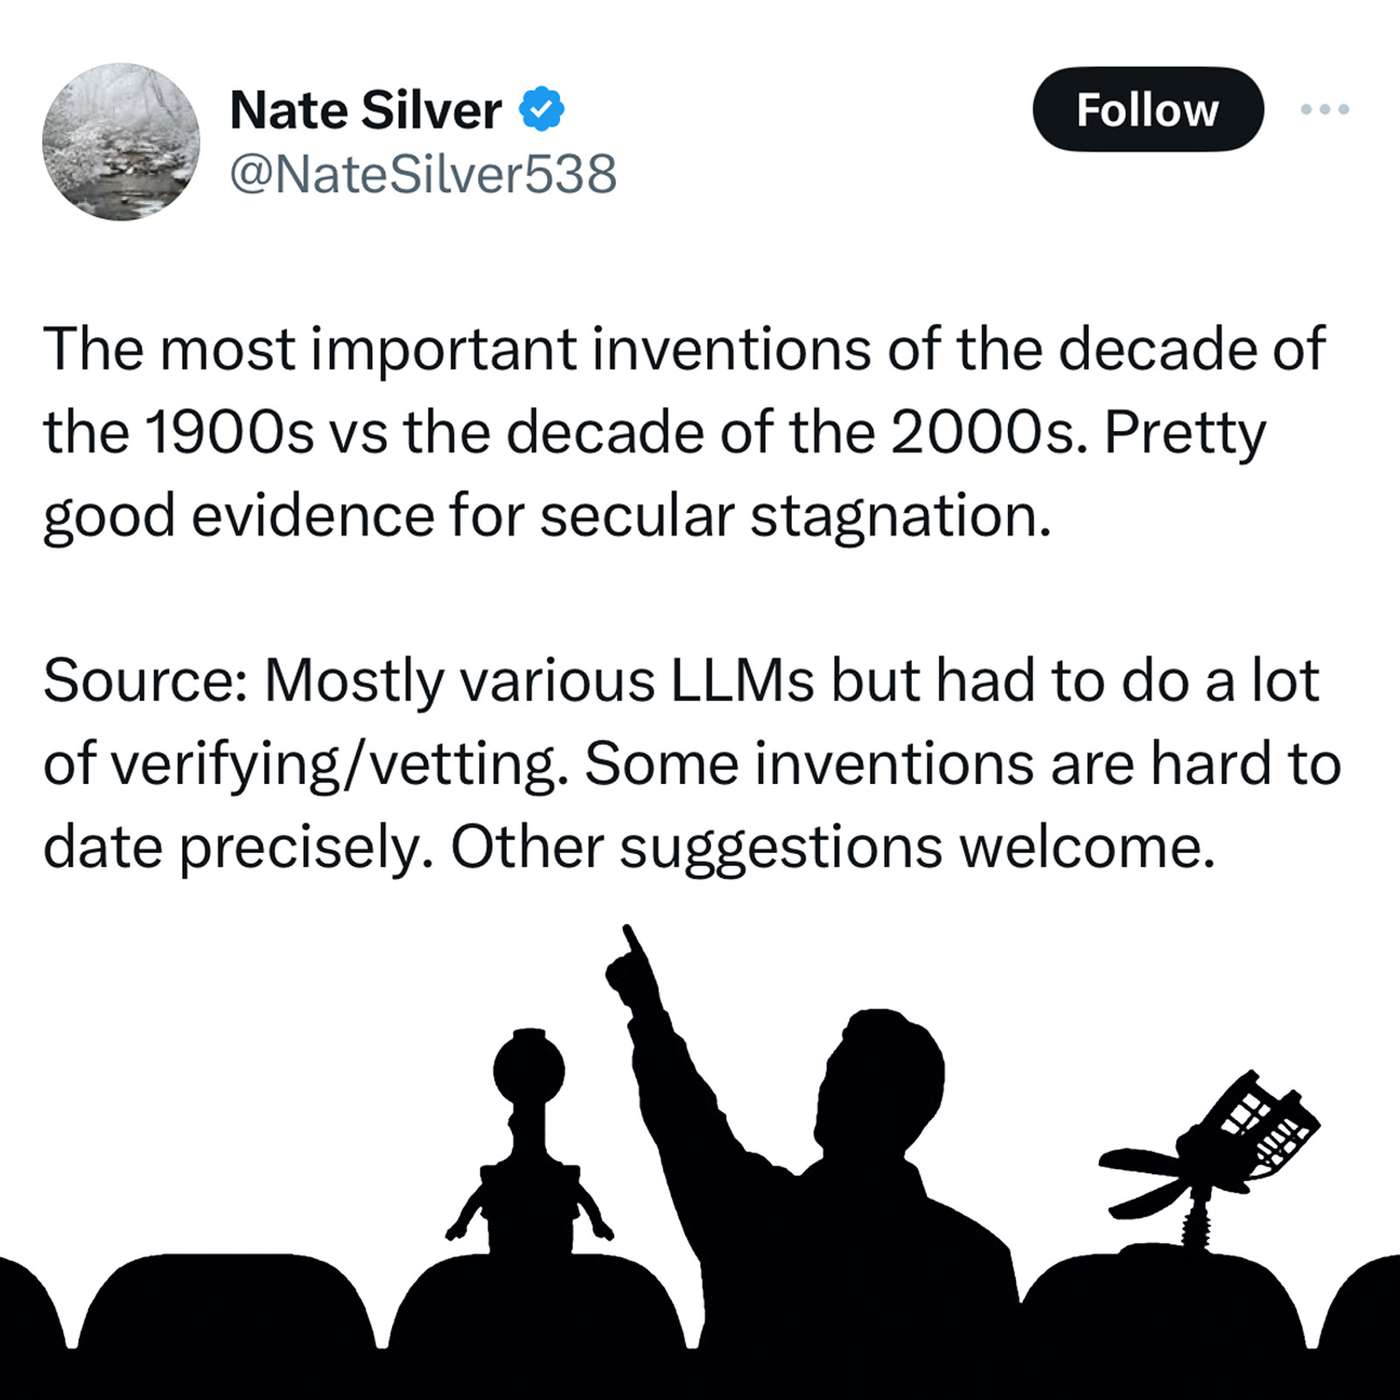
- (01:05:16) - Survivorship Bias
- (01:15:03) - Kartlytics
- (01:18:15) - Kartlytics sample group
- (01:19:11) - Wrapping up
- (01:22:02) - OxF book club
Some of the topics we hit on, in the order that we hit them:
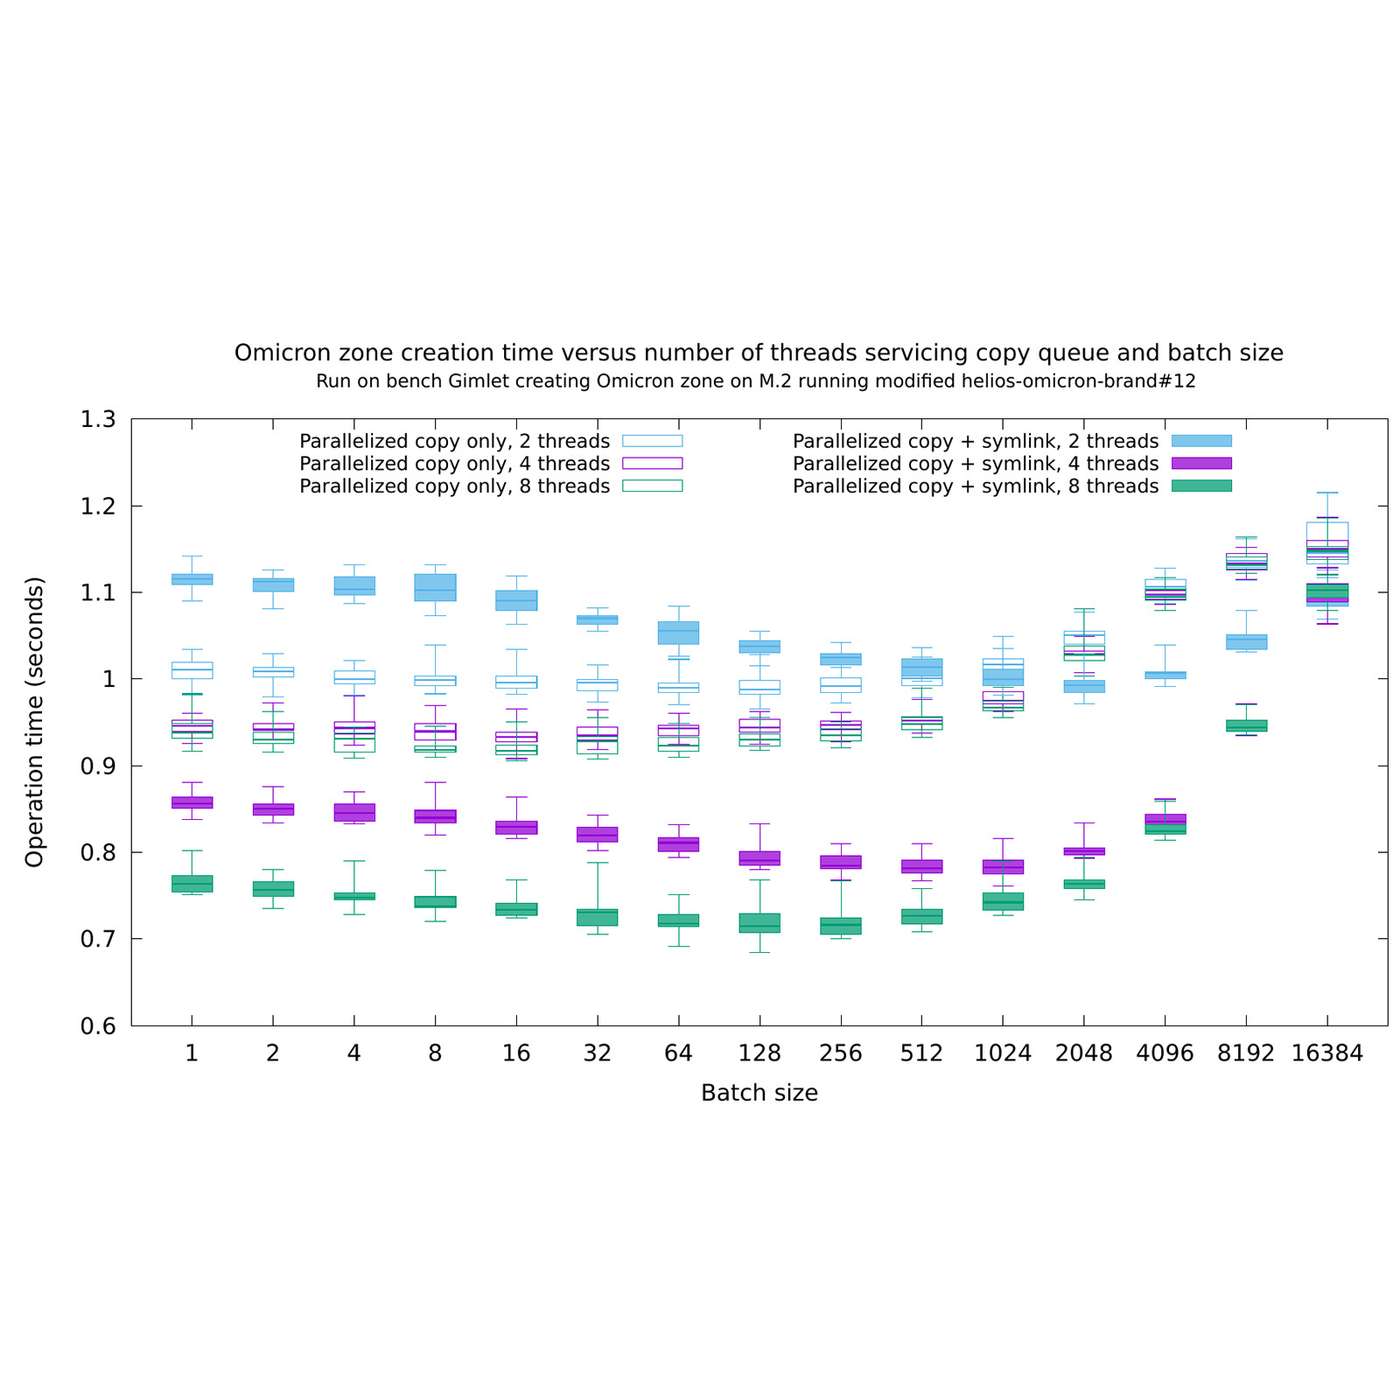
- Bryan's rad gnuplot
- Tufte
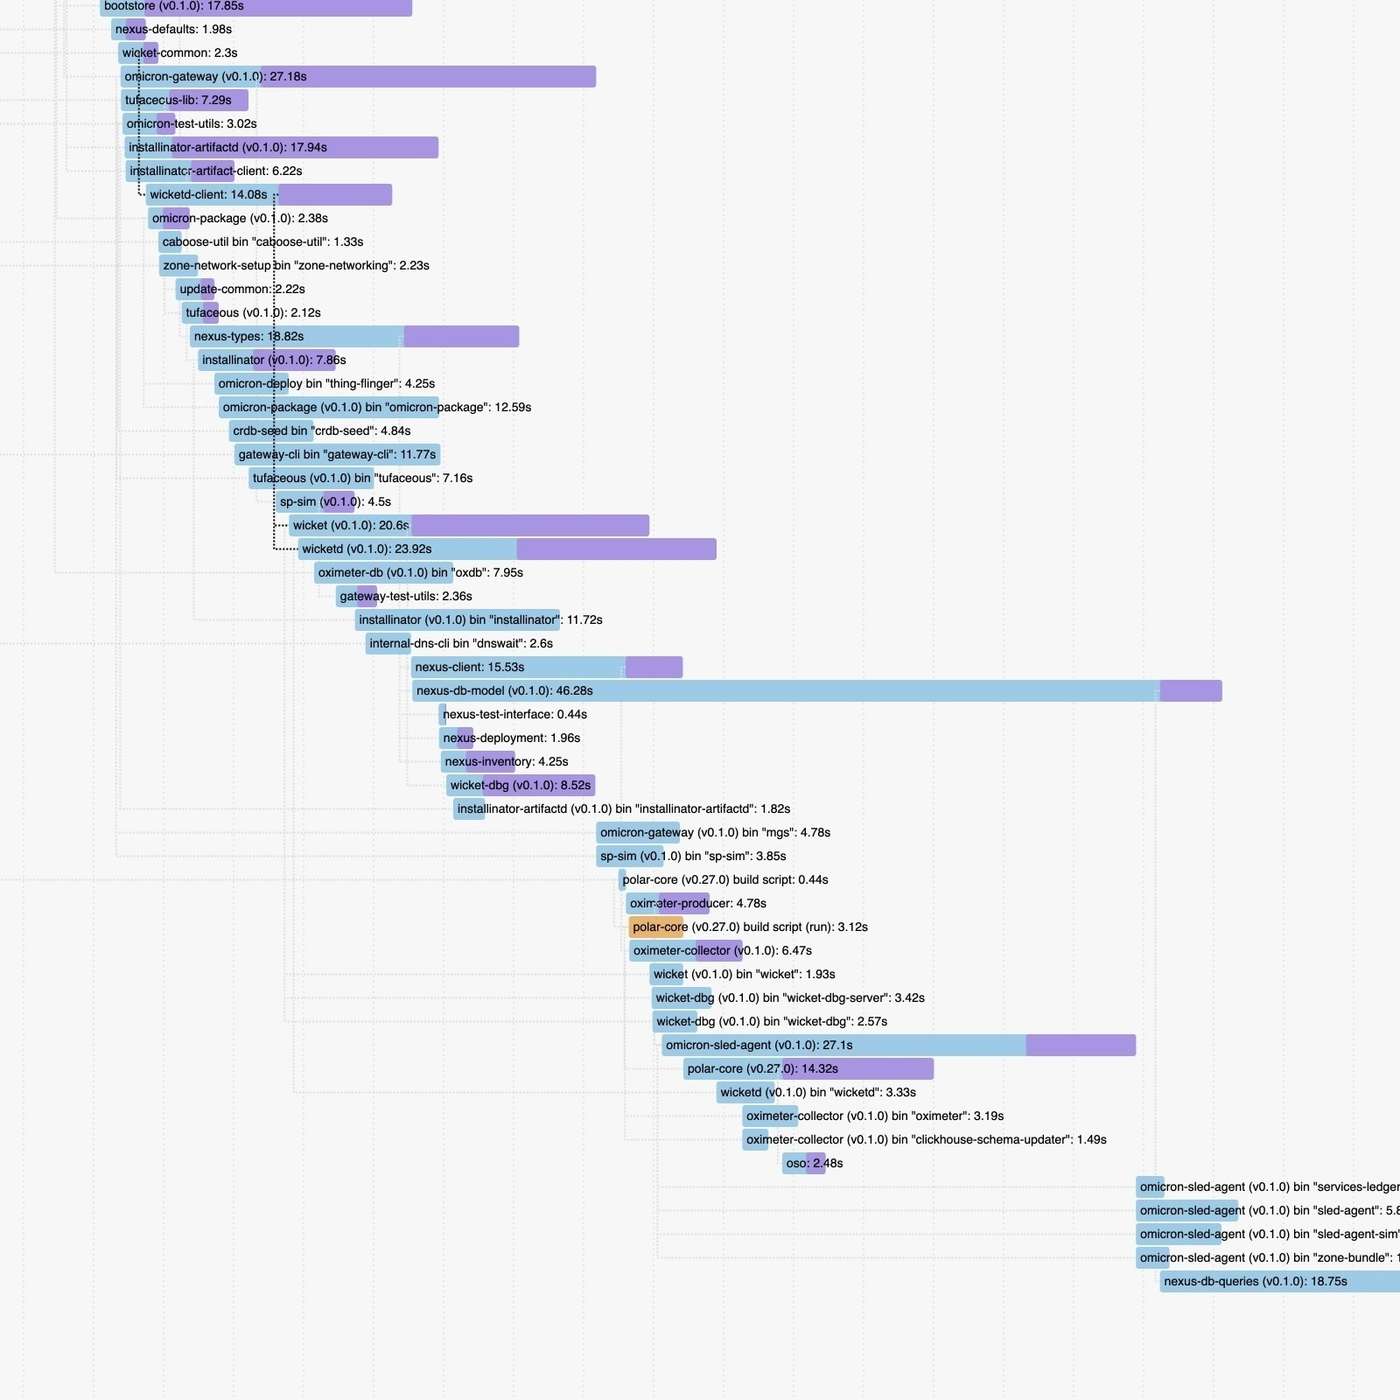
- Flame Graphs
- flamegraph-rs
- OODA
- This American Life: A Little Bit of Knowledge
- Statemaps
- Minard's diagram
- https://twitter.com/thingskatedid/status/1386077306381242371
- plot.awk
- Visualizing regular expressions and BNF grammars with Graphviz
- Example implementations of isvg and idot
- DTrace aggregations
- Rust crate ratatui
- Programs and libraries for plotting and other data visualizations:
- Simpsons IMDB visualization
- Abraham Wald and the airplane diagram with red bullet holes – here’s the origin story
- Kartlytics
- How Life Works by Philip Ball
If we got something wrong or missed something, please file a PR! Our next show will likely be on Monday at 5p Pacific Time on our Discord server; stay tuned to our Mastodon feeds for details, or subscribe to this calendar. We'd love to have you join us, as we always love to hear from new speakers!
Next Episodes
Crucible: The Oxide Storage Service @ Oxide and Friends
📆 2024-02-14 16:45 / ⌛ 01:38:40
Innovation Stagnation? @ Oxide and Friends
📆 2024-02-07 16:45 / ⌛ 01:00:44

Helios @ Oxide and Friends
📆 2024-02-01 16:45 / ⌛ 01:47:50
What's taking so long?! @ Oxide and Friends
📆 2024-01-24 16:00 / ⌛ 01:35:10

Open Source LLMs with Simon Willison @ Oxide and Friends
📆 2024-01-17 17:00 / ⌛ 01:33:19